View GCB Specifications in GigaVUE-FM
After the GCB configuration, GCB periodically sends the statistics to GigaVUE-FM. In the GigaVUE-FM, you can view the list of available Monitoring Domains, Source Inventories, and Traffic Policies. Refer to the following topics for detailed information.
- View GCB Monitoring Domain
- View Source Inventory
- View GCB Specifications in GigaVUE-FM
- View GCB Log Level Settings
View GCB Monitoring Domain
To view the Monitoring Domains of GCB in GigaVUE-FM, navigate to Inventory > VIRTUAL > KubernetesGCB > Monitoring Domain. The Monitoring Domain page appear with the list of Monitoring Domains.
In the Monitoring Domains list, click on a Monitoring Domain name to view the details of the selected Monitoring Domain.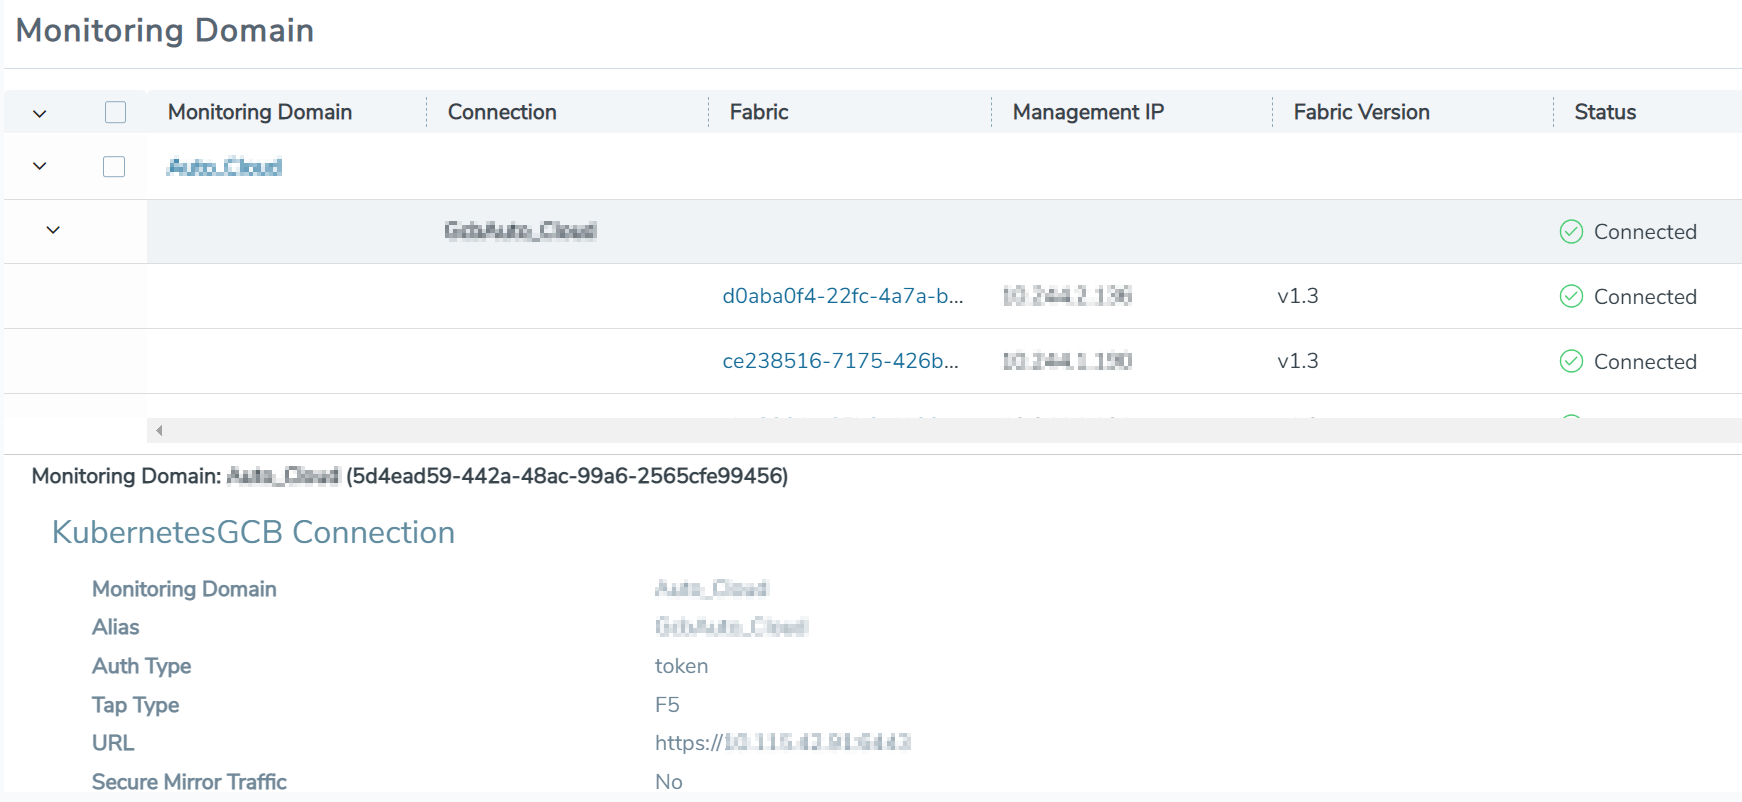
From any existing Monitoring Domain cluster, click on a GCB fabric to view the Rule Tunnels and statistics.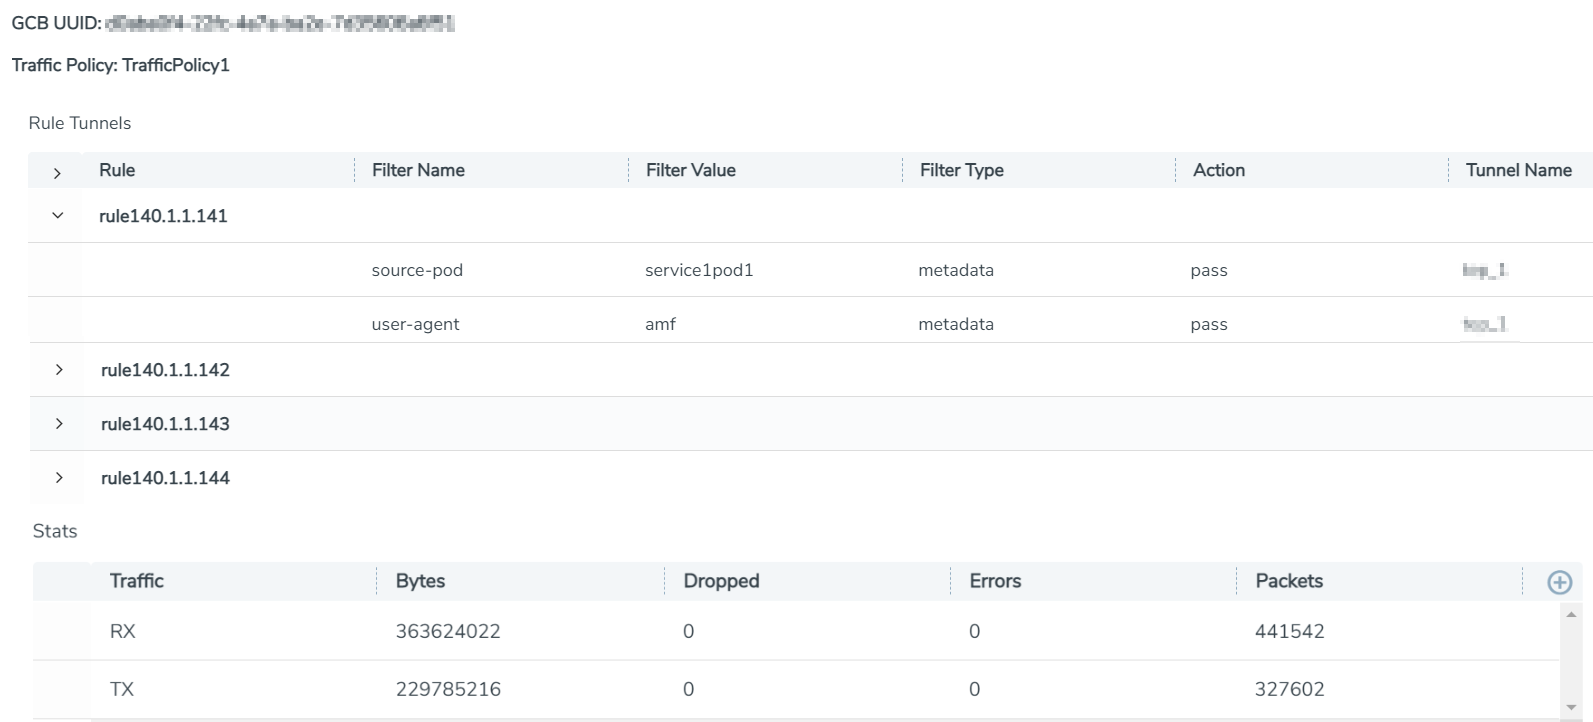
View Source Inventory
To view the Kubernetes Cluster Source Inventory of GCB in GigaVUE-FM, navigate to Inventory > VIRTUAL > KubernetesGCB > Source Inventory. The Source Inventory page appears with the list of Kubernetes cluster inventories. You can add, edit, or delete the Source Inventory of Kubernetes clusters only through REST APIs but not through GigaVUE-FM GUI.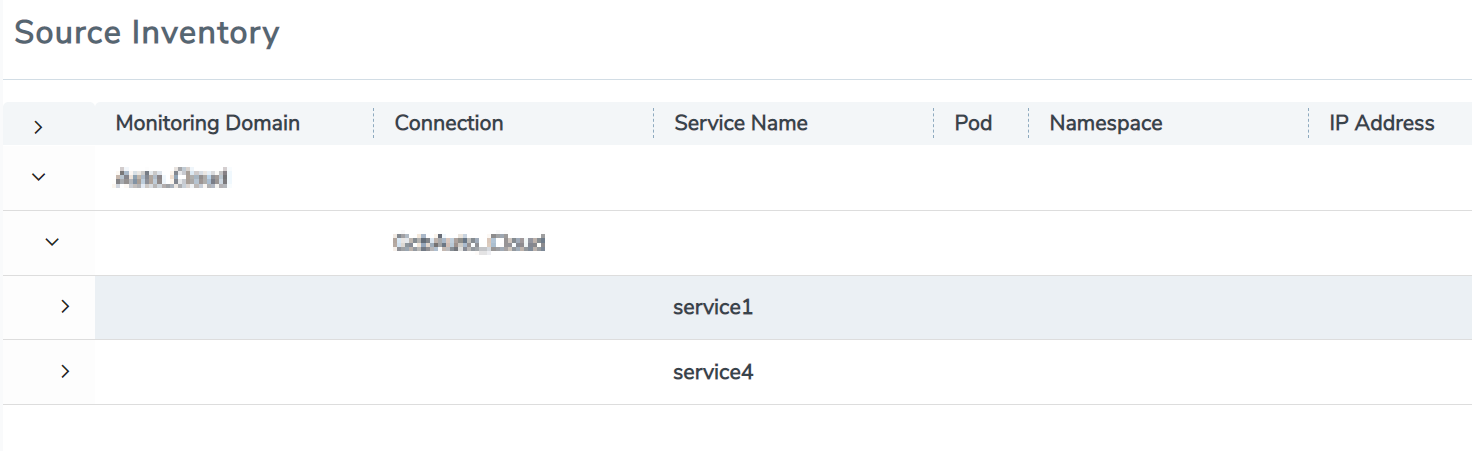
View GCB Traffic Policy
To view the Traffic Policies (Monitoring Sessions) of GCB in GigaVUE-FM, navigate to Traffic > VIRTUAL > Orchestrated Flows > KubernetesGCB. The Traffic Policy page appears with the list of Traffic Policies.
From any existing Traffic Policy, click on the Tunnel Name. The Tunnel quick view appears with the details of the selected tunnel. 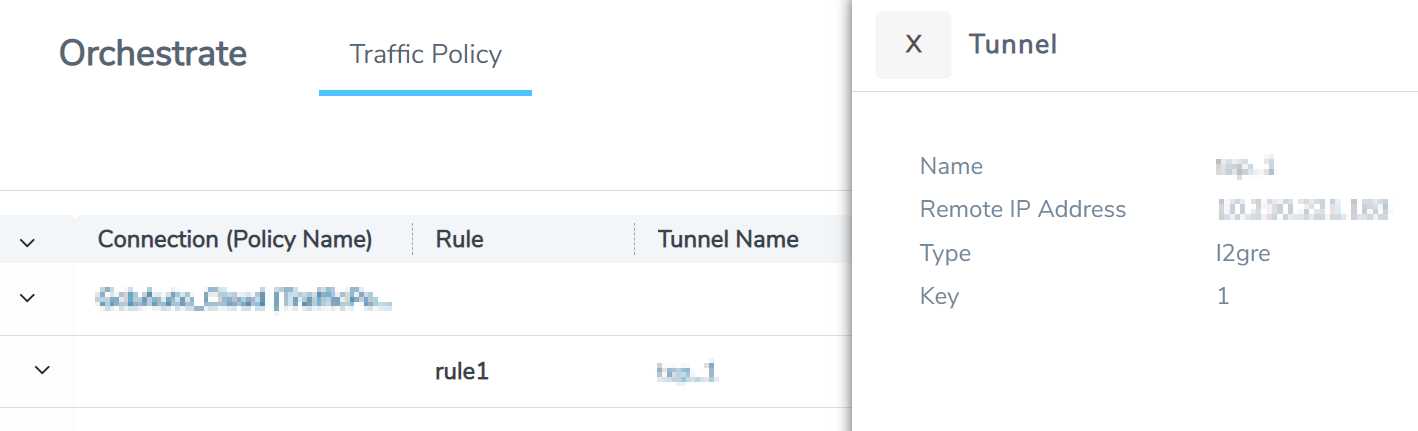
Click on the Connection (Policy Name) to view the status of the last operation performed on the policy.
View GCB Log Level Settings
Note: Early Access is a pre-GA feature status indicating it is not recommended for production networks. The functionality has been tested. Little to no system testing has been performed, however, and performance/scale data is not yet available. Preliminary documentation is available.
In GigaVUE-FM you can control the level of logs created at each individual GCB for troubleshooting.
To view or edit the GCB log level settings:
- In GigaVUE-FM, navigate to Inventory > VIRTUAL > KubernetesGCB > Settings, the Settings page appears.
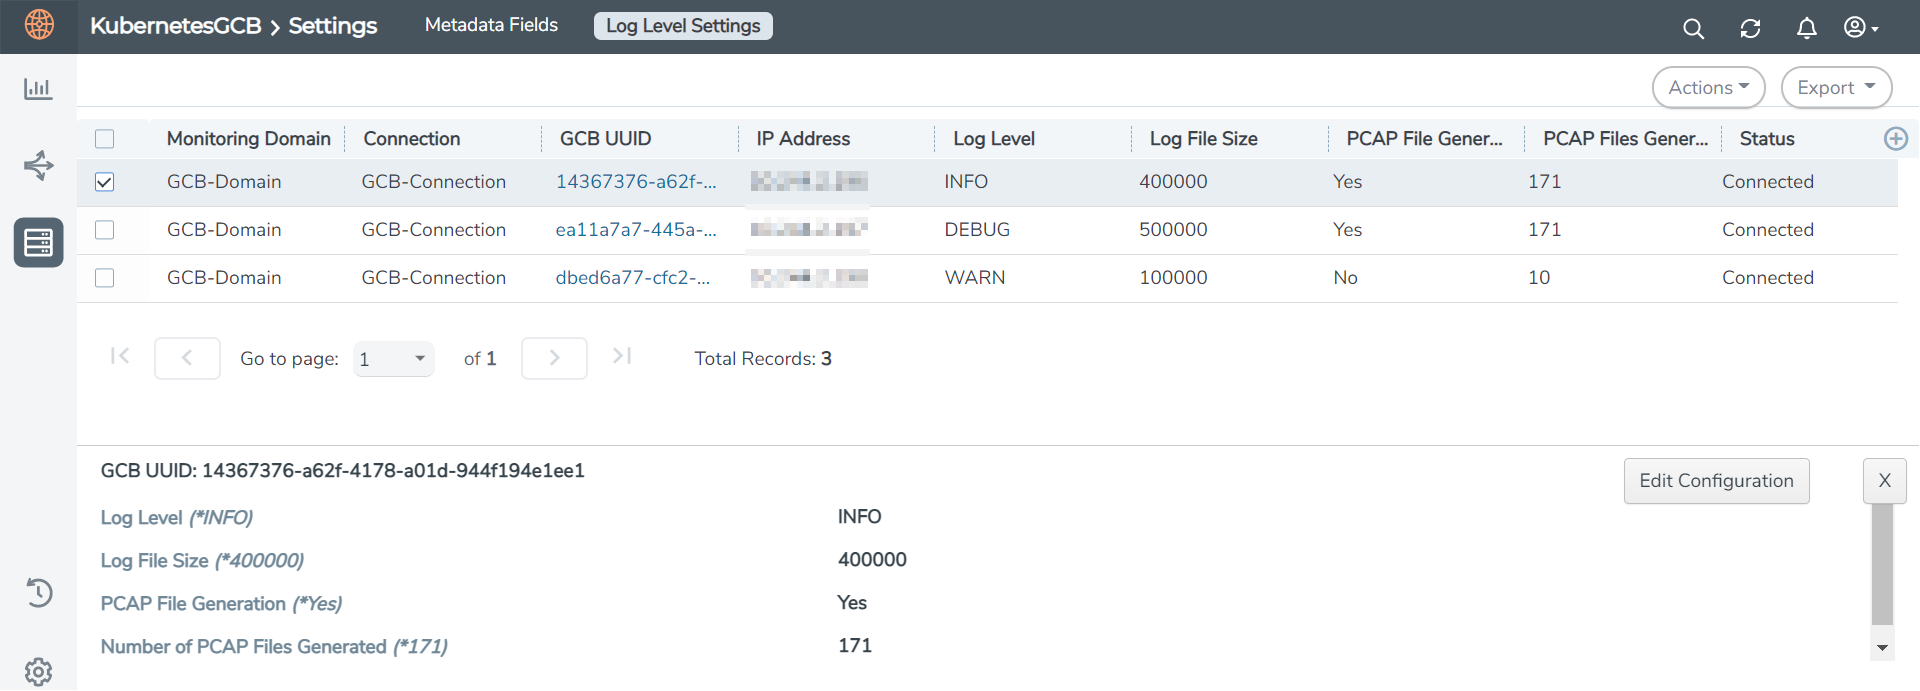
- From the Settings page, select Log Level Settings tab to view the list of GCB settings.
- Select a GCB and select Actions
> View Configuration to view the GCB log configuration.
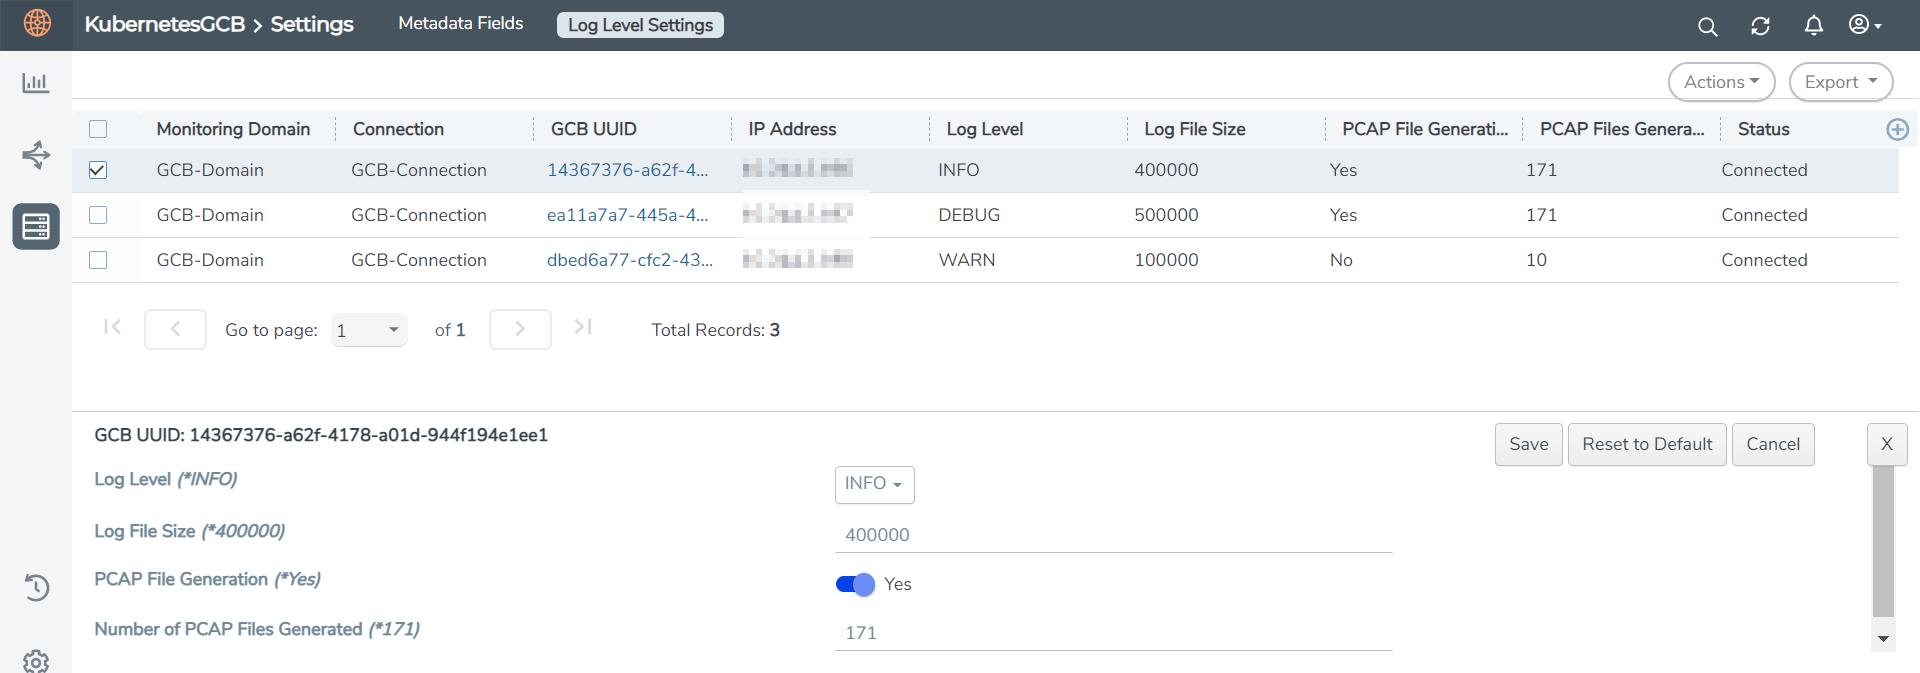
- Select a GCB and select Actions
> Edit Configuration to edit the selected GCB log configuration.
Note: You can select multiple GCBs to modify the configuration with the same value.
Field
Description Log Levels Select one of the following:
- DEBUG—fine-grained log information for application debugging
- INFO—coarse-grained log information for highlighting application progress
- WARN—log information of potentially harmful situations
- ERROR—log information of the error events that allows the application to run continuously
- FATAL—log information of very severe error events that presumably lead the application to abort.
Log File Size
Enter a value for the number of lines in the GCB log file.
PCAP File Generation
Select Yes to generate the PCAP file and select No to continue without the PCAP file.
Number of PCAP Files Generated
Enter a value for the number of PCAP files to be generated and stored on the GCB.


